
The Maintenance Budget Most Operators Get Wrong
The story most operators are telling themselves right now is that maintenance is a luxury they can no longer afford. Margins are thin. Food costs are elevated. Labor is up.
Here’s the reality: the restaurant groups protecting their margins aren’t cutting maintenance. They’re spending it more intelligently. The difference between operators who are struggling and those who are growing usually isn’t sales volume. It’s discipline around how their buildings run and how they allocate money to keep them running.
The Industry Benchmark: 1% to 3% of Revenue
According to the National Restaurant Association’s 2025 Restaurant Operations Data Abstract, the median full-service restaurant earned just 2.8% of sales as income before taxes, with limited-service only modestly better at 4.0%. Industry data points to a healthy repairs and maintenance (R&M) range of 1% to 2% of annual sales, with some sources stretching to 2% to 6% depending on equipment age, building condition, and operating volume.
What that looks like in practice:
- Single unit at $1M revenue: $10,000 to $30,000 in annual maintenance spend
- 10-unit group at $10M revenue: $100,000 to $300,000 per year
- Spending below 1%: Almost always deferred maintenance, not efficient operations
- Spending consistently above 3%: Usually a reactive operation paying for chaos
The right question isn’t “how do we spend less?” It’s “where do we get the most return per dollar?”
Where the Money Actually Goes: HVAC and Refrigeration
According to the EIA’s Commercial Buildings Energy Consumption Survey (CBECS), food service buildings are among the most energy-intensive commercial properties in the country, using roughly four times the energy per square foot of the average commercial building (263 versus 70 kBTU per square foot). Energy Star puts it another way: restaurants use 5 to 7 times more energy per square foot than other commercial buildings, and high-volume quick-service restaurants up to 10 times more. That concentration tells you exactly where maintenance dollars need to go.
The CBECS end-use breakdown for food service:
- Cooking: about 40%
- Refrigeration: about 15%
- Space heating: about 12%
- Space cooling, ventilation, and all other uses: 7% or less each
Cooling looks small as a share, but that number is misleading. Food service has the highest cooling energy intensity of any commercial building type EIA tracks, 19.1 kBTU per square foot, because the heat thrown off by a busy cook line and the huge volumes of air pulled through exhaust hoods put a heavy, constant load on HVAC and ventilation. The more intense the kitchen, the harder those systems work. It just gets split across space cooling, ventilation, and refrigeration rather than showing up as one headline number.
Add up refrigeration, space heating, cooling, and ventilation, and HVAC and refrigeration account for roughly 35 to 40% of a restaurant’s energy use, and the systems running hardest are the ones that fail soonest. A walk-in cooler going down on a Saturday night isn’t just an emergency repair charge. It’s spoiled inventory, a potential health code violation, and lost revenue from a kitchen that can’t function.
How Maintenance Costs Break Down: The Actuate Baseline
The dollars shift by concept, but the priorities don’t. To see where a specific operator’s money actually goes, Actuate builds a maintenance cost baseline from the equipment up, every rooftop unit, compressor, walk-in, and motor, using real service data and industry benchmarks for each piece. It turns a vague “1 to 3% of sales” into a real number, by system, per site.
What those baselines typically show:
| Segment | Estimated Annual Maintenance Per Unit |
|---|---|
| Quick-service | $25,000 to $40,000 |
| Fast casual | $20,000 to $35,000 |
| Casual dining | $15,000 to $30,000 |
| Fine dining | $30,000 to $50,000 |
And one pattern holds across nearly every baseline: HVAC and refrigeration are the single largest share of the R&M budget. In Actuate’s equipment-level baselines they typically account for a massive portion of the restaurant’s spend; more than cooking equipment, plumbing, and everything else combined.
Notice the gap. HVAC and refrigeration are roughly 35 to 40% of the energy but 50 to 65% of the maintenance dollars, because they carry the moving parts that actually break: compressors, condenser and evaporator fans, blowers. That gap is the whole point. It is also exactly the equipment Act Hub monitors and controls. The largest, most failure-prone, most emergency-driven slice of the maintenance budget is the slice Actuate is built to manage.
The Portfolio Math Most Operators Underestimate
Single-store operators manage failure points. Portfolio operators manage probability.
A typical QSR runs roughly 35 distinct motors across HVAC, refrigeration, and ventilation: compressors, condenser fans, evaporator fans, supply blowers. Each one is an independent point of failure.
Scale that up:
- A 30-store operator is responsible for more than 1,000 individual rotating components
- At an industry-typical 8% to 10% annual failure rate, that’s 80 to 105 failure events per year
- That’s roughly two failures per week, or one emergency somewhere in the fleet every three to four days
Every one of those events triggers a service call, often at emergency rates, often after hours, often with food or revenue at risk. A single walk-in cooler failure on a Friday night can easily clear $5,000 once you factor in emergency dispatch, premium parts, spoiled inventory, and lost service time.
Reactive vs. Preventive vs. Predictive: What the DOE Data Shows
Most restaurant maintenance programs fall somewhere between reactive (run it till it breaks) and preventive (service on a calendar). The U.S. Department of Energy’s Operations & Maintenance Best Practices Guide makes the case that both approaches leave significant money on the table.
The cost differences by maintenance mode:
- Preventive over reactive: 12% to 18% lower maintenance cost
- Predictive over preventive: additional 8% to 12% savings on top of that
- Full predictive programs: cited at roughly 10x ROI, with 25% to 30% reductions in overall maintenance cost vs. reactive
What top-performing facilities actually look like:
- Less than 10% reactive maintenance
- 25% to 35% preventive
- 45% to 55% predictive
That’s the inverse of an average operation.
The practical difference: preventive maintenance changes the oil at 5,000 miles whether it needs it or not. Predictive maintenance reads the actual condition of the equipment and triggers work only when the data shows it’s warranted. A walk-in compressor short-cycling for two weeks before failure is invisible on a calendar-based service plan. It’s obvious in the runtime data.
Why Rising Energy Costs Change the Calculation
Energy costs are moving in the wrong direction for multi-location operators. According to the EIA’s Annual Energy Outlook, commercial electricity prices are projected to continue rising through the end of the decade, driven by data center demand, grid modernization, and natural gas volatility. Many regional utilities have already filed for double-digit rate increases.
For restaurant portfolios running at four times the commercial energy intensity average, even a modest rate increase compounds quickly across a fleet.
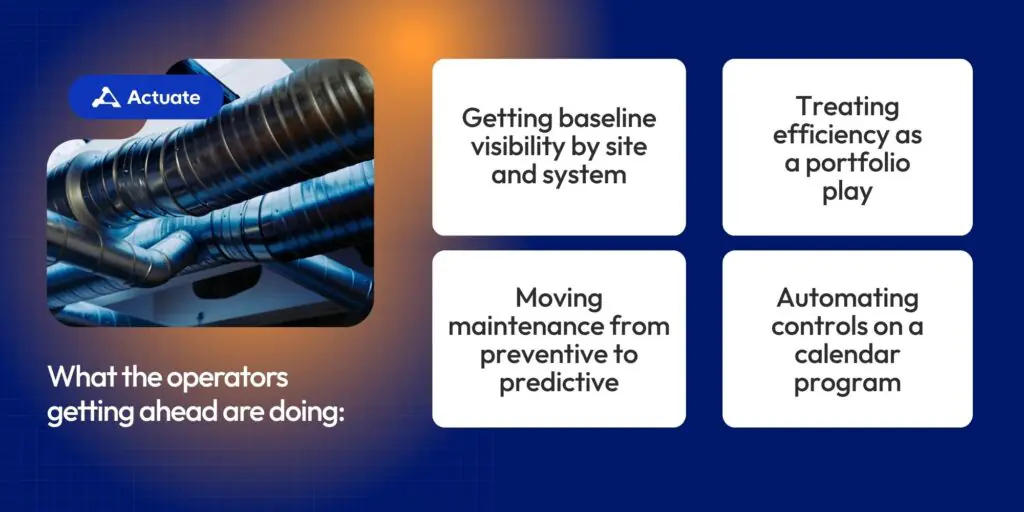
What the operators getting ahead are doing:
- Getting baseline visibility by site and system. Utility bills tell you what you spent, not where it went or why
- Treating efficiency as a portfolio play. A 5% drop in HVAC energy use across 50 stores is a fundamentally different number than the same drop at one
- Moving HVAC and refrigeration from preventive to predictive. This is where energy and reliability savings stack (10% to 25% per system, per DOE figures)
- Automating controls. Setpoints, schedules, and refrigeration recipes drift constantly between service calls; drift is invisible on a calendar program and shows up immediately in continuous data
How Actuate Helps Distributed Operators Close the Gap
Most restaurant portfolios don’t have an on-site facilities manager at every location. That’s the gap Act Hub was built for.
Act Hub collects high-frequency performance data on HVAC, refrigeration, ventilation, and lighting across your portfolio, interprets that data, and surfaces problems before they become work orders. It automates controls so that setpoints and schedules don’t drift out of spec between service calls.
The point isn’t that more data solves a maintenance budget problem. It’s that without visibility, you can’t actually allocate one. You’re either spending too little and accumulating risk, or chasing fires. With continuous performance data interpreted by the platform, the same maintenance dollar does more work, and the equipment lasts longer in the process.
Frequently Asked Questions
Industry benchmarks put healthy R&M spending at 1% to 2% of annual sales, with some operations running up to 3% depending on equipment age and building condition. Consistently spending below 1% is almost always a sign of deferred maintenance, not efficient operations.
What systems should get the most maintenance investment?
HVAC and refrigeration. Combined, they represent 35% to 55% of total restaurant energy use and cause the most disruptive failures when they go down. These systems should receive the largest share of preventive and predictive maintenance investment at every concept tier.
What’s the difference between preventive and predictive maintenance?
Preventive maintenance runs on a calendar and services the equipment at set intervals regardless of its actual condition. Predictive maintenance monitors real-time equipment data and triggers work only when condition indicators show it’s needed. Predictive programs deliver an additional 8% to 12% cost savings over preventive alone, according to the U.S. DOE.
How many failure events should a multi-location operator expect each year?
At an industry-typical 8% to 10% annual failure rate for commercial equipment, a 30-store operator running approximately 1,000 rotating components can expect 80 to 105 failure events per year (roughly two per week).
How does energy efficiency connect to maintenance?
They’re directly linked. As equipment degrades, it runs harder, longer, and less efficiently. Refrigerant loss, dirty coils, and off-spec cycling all show up as higher energy consumption before they show up as a failure. Operators who catch performance drift early reduce both emergency repair costs and energy spend simultaneously.
What does Act Hub do differently than basic monitoring?
Basic monitoring tools capture readings and generate alerts. Act Hub interprets high-frequency equipment data, explains what changed and why, and surfaces clear next steps before a problem becomes a work order. It also automates controls across the portfolio so performance doesn’t drift between service visits.