ENERGYHUB · THE FACILITY LEVER ON MARGIN

Turn your energy use into a managed asset.

See how each system should be performing, not just what it’s costing you.

EnergyHub models how every system should be running, so drift shows up as an early signal instead of a surprise on the bill. Energy stops being a number you brace for and becomes one you optimize.

N

A new lever on margin

N

Real-time across every location

N

No engineering team required

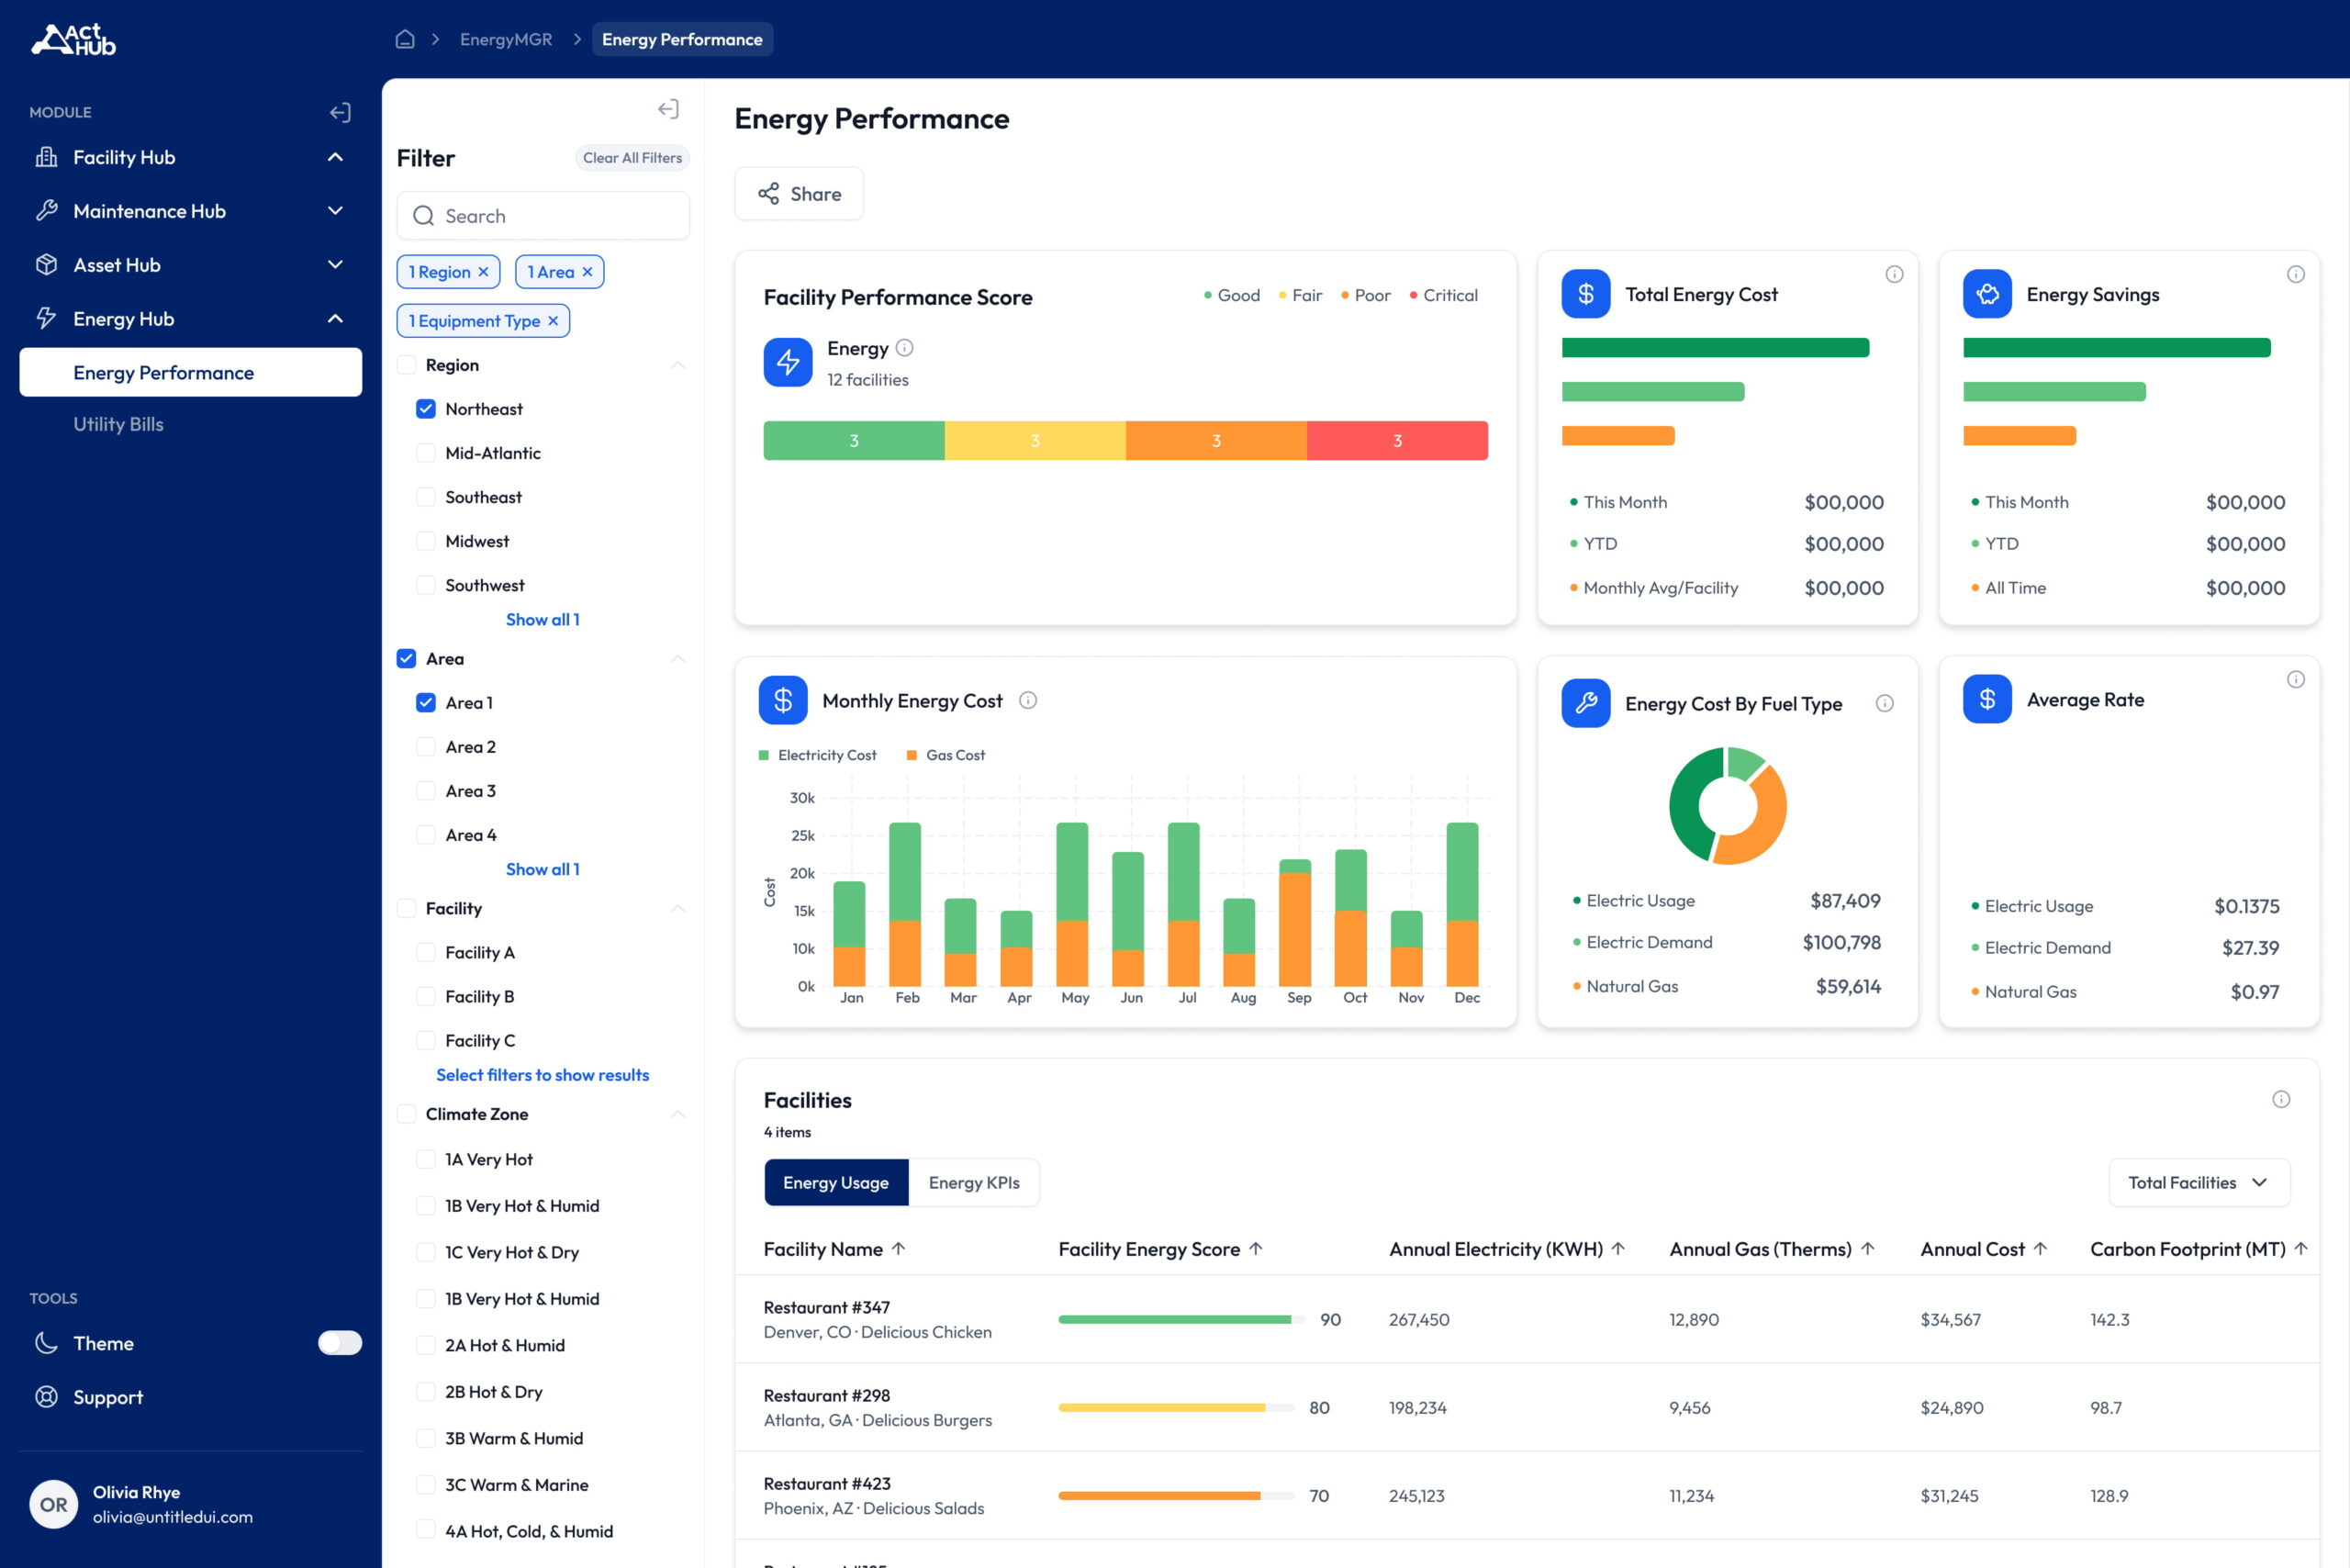
EnergyHub - Performance Dashboard

Digital Energy Twins

See what each system should be using, not just what it did.

EnergyHub builds a model of how each system should perform given weather and schedule, so a refrigerant leak or failing compressor shows up as a gap between expected and actual, not a mystery on next month’s bill.

Expected vs. Actual, Every System

See where consumption is drifting from what the model expects, before it shows up as waste.

Energy Scored For Each Location & System

Compare locations fairly, adjusted for weather and operating hours.

No Surprises, No Mysteries

Understand what’s driving the bill, down to the equipment.

ENERGY MODEL SYNCED 92.4 EFFICIENCY EXPECTED BASELINE 4,840 kWh ACTUAL 4,975 kWh CURRENT FLAGS Rooftop Unit 2 Drift Nashville Gulch — running above expected load Compressed Air Leak Dallas Auto Body — active during closed hours

Revenue performance without the reactive chaos.

Stop losing valuable time and energy over a single equipment emergency.

Prioritized Backlog

Categorized by priority, actionable by design.

Energy drift is often the first sign something is going wrong, long before a comfort complaint or a failure.

CRITICAL DRIFT #ALT-9901 Walk-In Compressor
Chicago River North — running well above its expected load
ANNUAL WASTE +$1,420 / year
WARNING DRIFT #ALT-9884 Compressor 1 Short-Cycling
RTU2-Kitchen · Portland Pearl · starting 14 times an hour against a limit of 6
ANNUAL WASTE $525 / year
ON TARGET #ALT-9842 Denver LoDo
Matching its expected performance model closely
CURRENT EFFICIENCY 99.4% Match
ACTIVE AUTOMATION #AUT-9810 Walk-In Optimization
Austin Domain · defrost and fan cycles tuning to real load, box temp held to spec
ENERGY SAVED, YTD 14,000 kWh
Ecosystem Capabilities

Operational clarity, measured.

How EnergyHub translates active operational intelligence into enterprise-grade utility and facility improvements.

01 · Tracking

Sub-Meter Tracking

Track consumption at the circuit and equipment level across every location.

02 · Demand

Peak Demand Awareness

Understand what’s driving demand charges, and where they can be trimmed.

03 · Twins

Digital Energy Twins

A model of how each system should run, so drift shows up early.

04 · Automation

Equipment Automations

Set points and schedules that tune themselves to occupied hours.

05 · Tariffs

Rate & Tariff Review

See how your rate structure compares and where it’s costing you.

06 · Decarbonization

Portfolio Energy Scoring

Rank every location on the same scale, adjusted fairly for weather and hours.

07 · Accuracy

Weather Normalization

See every store compared to the same baseline.

08 · Efficiency

Energy Efficiency Opportunities

Act Hub uncovers high ROI energy efficiency opportunities.

WHAT CHANGES ON THE ENERGY LINE

Impact measured in a bill you understand.

See how EnergyHub delivers structural bottom-line value across major industrial facility portfolios.

Energy waste gets a name and a location instead of hiding in the total.
Demand charges become something you can see coming, not just pay.
Set points and schedules run themselves instead of drifting.
The energy line moves from a bill you brace for to a number you manage.

WORKFLOW FLOW

Four steps from raw data to action.

How EnergyHub turns unstructured telemetry feeds into closed-loop equipment automations.

01

Stage 01: Collect

Consumption and equipment data streams in continuously, alongside weather and schedule.

02

Stage 02: Model

EnergyHub builds an expected performance baseline for every system.

03

Stage 03: Detect

Drift from that baseline surfaces as it happens, not on next month’s bill.

04

Stage 04: Resolve

Adjust automatically where approved, or route a MaintenanceHub work order where a technician is needed.
ENTERPRISE OPERATIONS

Engineered for teams that need every ounce of margin.

Reliable protocols, robust security frameworks, and zero rip-and-replace deployments.

Works With What You Run

Connects natively to the building automation and metering you already have.

Secure By Design

Act Hub runs on a virtual, private cellular connection. No threat to a facilities IT or OT Networks

Advisory or Automated

Choose recommendations you approve, or let the platform act within limits you set.

Weather Normalized

Benchmarks stay fair across seasons and climates.

Built for Distributed Portfolios

Standardized across every location, however many you run.

High Platform Reliability

Built to be there when your team needs it.

Common Questions

What teams want to know.

What is EnergyHub?

EnergyHub is Actuate IoT’s energy management product, built on the ACT Hub platform. It uses wireless current sensors to measure energy consumption at the equipment level — individual machines, circuits, and systems — turning invisible waste into visible, actionable data so businesses can cut energy costs and catch inefficient equipment.

What does EnergyHub measure?

EnergyHub measures energy consumption at the equipment and circuit level — real-time power draw, consumption over time, run cycles, and load profiles for refrigeration, HVAC, production equipment, and major circuits. It breaks a single utility bill into its components, showing which equipment uses what, when, and whether that’s normal.

How does EnergyHub reduce energy costs?

EnergyHub reduces costs by making waste visible at the equipment level, where utility bills can’t. It exposes equipment running outside hours, refrigeration overworking from worn seals, HVAC fighting itself, and demand spikes that inflate charges — each a specific, fixable action with recurring savings.

How much can EnergyHub save on our energy bills?

Most commercial operations find 10–20% of energy consumption is reducible once EnergyHub makes the waste visible, with early savings often requiring no capital spending — just schedule fixes, settings corrections, and data-prompted maintenance. Demand charge reduction builds on that baseline. A single-site pilot produces a savings estimate on your own equipment.

Can EnergyHub help reduce demand charges?

Yes — demand charges are often 30–50% of a commercial electric bill, based on your peak consumption rather than total usage. EnergyHub shows exactly when peaks occur and which equipment causes them, enabling staggered start-ups, load shifting, and alerts as demand approaches a new peak.

Does EnergyHub support ESG and sustainability reporting?

Yes — EnergyHub produces measured consumption data (not estimates), which rolls up into the energy figures ESG disclosures, customer questionnaires, and sustainability frameworks increasingly require. It documents not just totals but the reduction trajectory over time, with the specific actions behind it — the difference between reporting that survives scrutiny and utility-bill estimates.

Does EnergyHub work for manufacturing and industrial energy monitoring?

Yes — EnergyHub monitors plant utilities and process equipment: compressed air (where leaks waste 20–30% of output), motors, pumps, chillers, and production lines each get a consumption profile. This supports both cost allocation — energy per line, shift, or product run — and the condition insights that come free with the data.

What sensors does EnergyHub use, and do they need an electrician?

EnergyHub uses current transformer (CT) sensors that clamp around existing conductors without cutting or splicing anything. Panel-level installation should be done by a qualified electrician for safety and code, but it’s a quick, non-invasive visit with no downtime; plug-level monitoring needs no electrical work at all.

Does EnergyHub use AI to find energy waste?

Yes — energy data suits automated anomaly detection well, because every load has a consistent consumption fingerprint. EnergyHub learns each asset’s normal pattern and flags deviations a fixed threshold would miss: a freezer drawing 20% above baseline, after-hours use where none should exist. Intelligence strengthens as history accumulates.

How much does EnergyHub cost?

EnergyHub is priced as sensor hardware plus a subscription covering connectivity, the ACT Hub platform, alerts, and support — scoped to the loads and sites you monitor. The cost is small relative to the bill it manages: with 10–20% of consumption typically reducible, most deployments pay back within 12–24 months.

Ready to see it in your Digital energy?

Ready to take control of your energy?

See where EnergyHub finds waste across your portfolio, and what your first week of data looks like.

N

30-min walkthrough

N

Real-time energy visibility

N

No engineering team needed